Investment Fee Schedule for Wealth Management Firm
Want to win a job like this?
This customer received 28 flyer designs from 6 designers. They chose this flyer design from creative.bugs as the winning design.
Join for free Find Design Jobs- Guaranteed
-
 US$110
-
 28 designs
-
 6 designers
Flyer Design Brief
We are a Chicago based firm that wants to illustrate our fee schedule for our Portfolios at different investment amounts. i.e. $50k & Under, $50k-$100k, $1-$250k, $250k-$750, $750-$1M etc. The idea is that the more money people invest they receive a volume discount. Each category has 4 portfolios with differing investment risk (Conservative, Balanced, Growth, Aggressive). Each portfolio is made up of Equities & Fixed Income shown as 20/80, 40/60/ 60/40 and 80/20. Need to name the Levels and make it easy for potential clients to understand. The attached is my sketch of how I came to price each model and might assist you in seeing how it works. May seem a bit complicated but really its just a variation on a theme. We need help communicating this in a marketing piece. We are easy to talk and work with. Hope to partner with you! Thank you for your consideration.
Update Brief 11/27/18
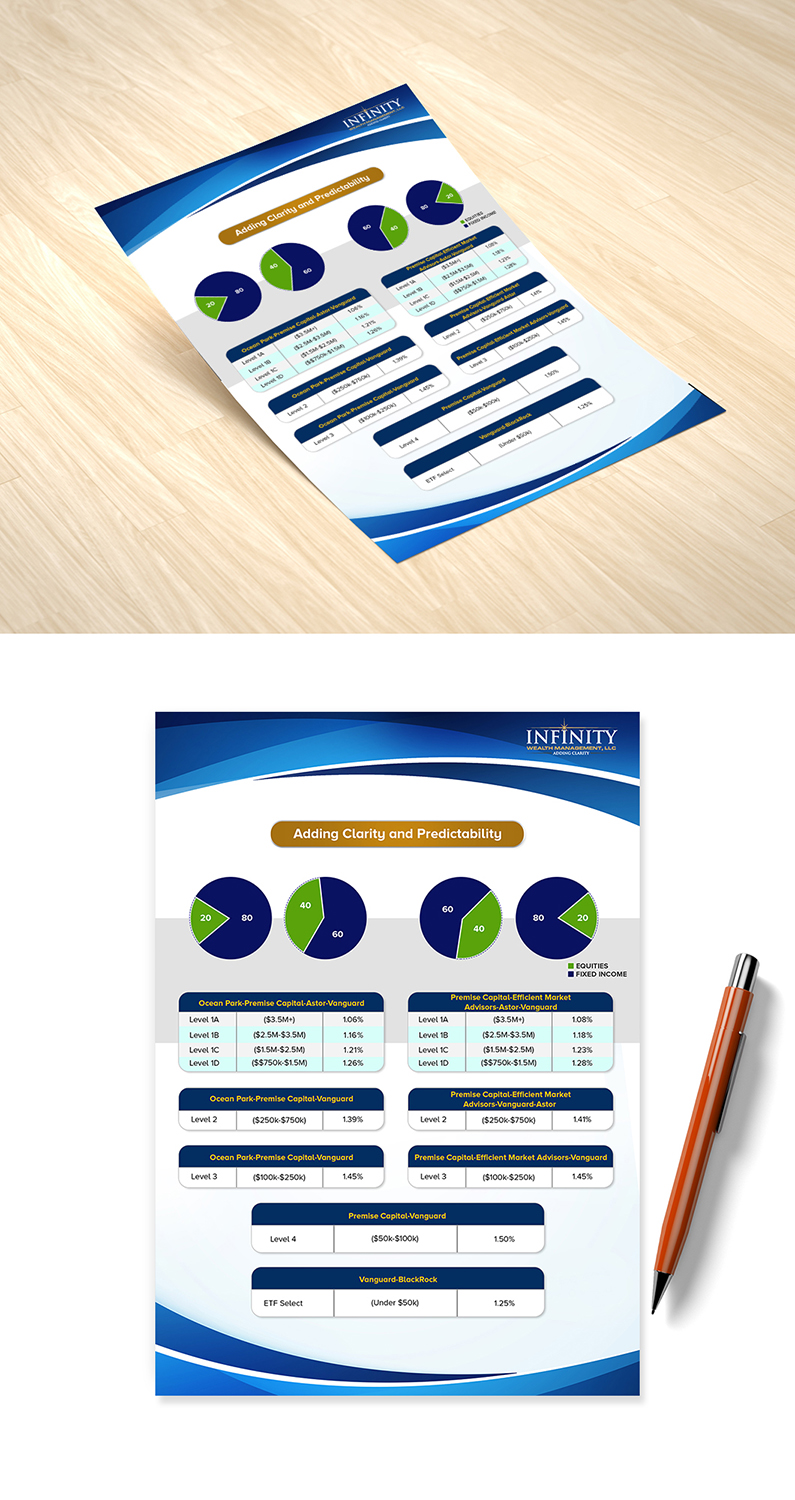
Some of the info I provided is not necessary and can be omitted. I would like the pie charts to be more traditional where the pie is broken down into solid color inside the circle.
Can we also take the table that you have at the top under the pie charts and expand on it? I believe that the top line should be a banner that says the companies being invested in. Under the 20/80 and 40/60 pies it would say the investment firms being used. Then the next line on this left side of the page in the same table would begin the pricing models starting with the word Level instead of tier.
Ocean Park-Premise Capital-Astor-Vanguard
Level 1A ($3.5M+) 1.06%
Level 1B ($2.5M-$3.5M) 1.16%
Level 1C ($1.5M-$2.5M) 1.21%
Level 1D ($$750k-$1.5M) 1.26%
On the right side under the 60/40 and 80/20 pie the banner would say:
Premise Capital-Efficient Market Advisors-Astor-Vanguard
Level 1A ($3.5M+) 1.08%
Level 1B ($2.5M-$3.5M) 1.18%
Level 1C ($1.5M-$2.5M) 1.23%
Level 1D ($$750k-$1.5M) 1.28%
Below these two tables would be two more tables maybe in a different shade to distinguish it from the Level one tables.
The banner again would show the investment firms being used under the two models 20/80 and 40/60.
Ocean Park-Premise Capital-Astor-Vanguard
Level 2 ($250k-$750k) 1.39%
Ocean Park-Premise Capital-Vanguard
Level 3 ($100k-$250k) 1.45%
The next two Levels would have the banner run along the whole width of the page under all of the four models since they are using the same investment management firms.
Premise Capital-Vanguard
Level 4($50k-$100k) 1.50%
Vanguard-BlackRock
ETF Select (Under $50k) 1.25%
On the right side under the 60/40 and 80/20 pie the banner would say:
Premise Capital-Efficient Market Advisors-Vanguard-Astor
Level 2 ($250k-$750k) 1.41%
Premise Capital-Efficient Market Advisors-Vanguard
Level 3 ($100k-$250k) 1.45%
I really tried to convey my vision but it's a bit hard to do so in words. I would be happy to email you a hand written copy of what I just said above.
Thank you!
John S.
Target Market(s)
Individual Investors
Industry/Entity Type
Financial Planning
Font styles to use
Look and feel
Each slider illustrates characteristics of the customer's brand and the style your logo design should communicate.
Elegant
Bold
Playful
Serious
Traditional
Modern
Personable
Professional
Feminine
Masculine
Colorful
Conservative
Economical
Upmarket
Requirements
Must have
- Professional Appeal